What is Netdata?
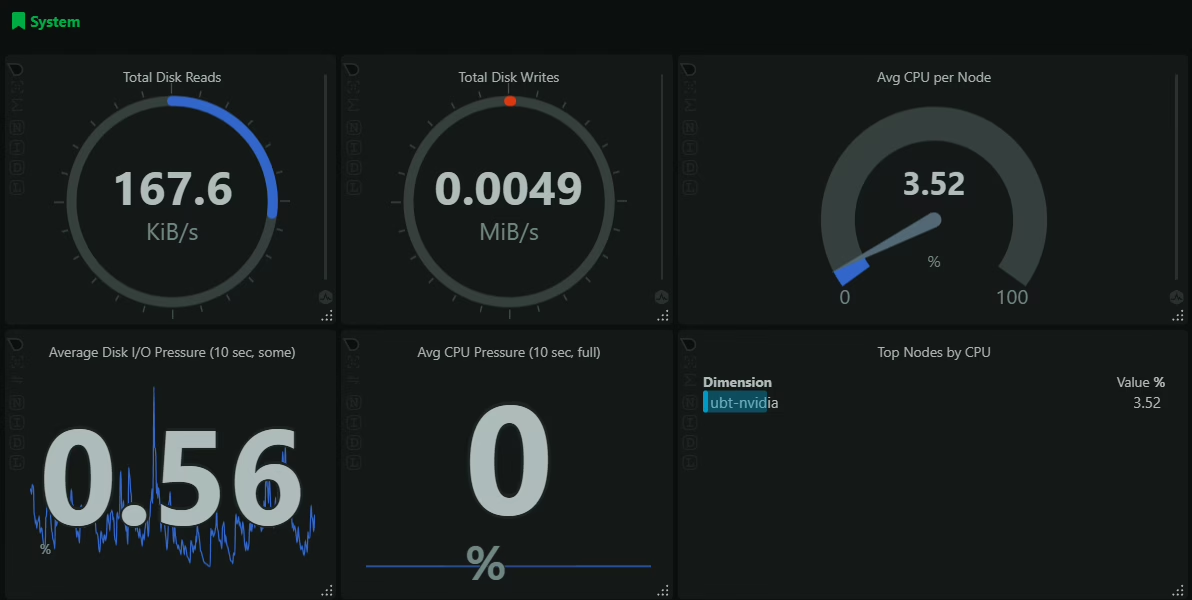
Netdata is a lightweight, open-source monitoring tool designed for real-time performance metrics. It provides instant insights into system health, applications, and containers with minimal overhead.
Alarms in Netdata
Netdata supports alarms directly on the agent or centrally via Netdata Cloud. Agent-based alarms are configured in local .conf files, while Netdata Cloud offers centralized alert management across multiple nodes. This setup ensures flexibility for tailored monitoring and fast incident response.
Find install folder
This example demonstrates setting up a GPU load alarm on an Ubuntu server with an NVIDIA GPU. The alarm will trigger when GPU utilization exceeds or falls below a defined threshold, ensuring precise monitoring and timely notifications.
Assuming the Netdata agent is already installed, the first step is to locate its installation directory. This path varies depending on the installation method. Specifically, we need to find the health.d folder, where Netdata stores alarm configurations. To locate it, use the following command:
sudo find / -name health.d -type d 2>/dev/nullThe health.d folder stores Netdata’s alarm configurations. Place your .conf file here to define thresholds and conditions. Netdata applies these during the next health check or configuration reload.
Result on my Server:
sudo find / -name health.d -type d 2>/dev/null
/usr/lib/netdata/conf.d/health.d
/etc/netdata/health.d
Let’s move into the folder:
cd /etc/netdata/health.dCreate the .conf File
The next step is to create your custom .conf file for the GPU load alarm.
sudo nano gpu_load_alarm.confThe name of the .conf file and the alarm can be customized to fit your needs. For example, you can name the configuration file gpu_load_alarm.conf and the alarm gpu_load_monitoring. Make sure the names are descriptive for easy identification and management.
For our GPU load alarm, use the following code:
template: gpu_load_alarm
on: nvidia_smi.gpu_utilization
lookup: average -30s
units: %
every: 10s
warn: $this > 10
crit: $this > 20
info: "GPU load is high. Check system performance."
to: sysadmin
In our GPU load alarm configuration, we use on: nvidia_smi.gpu_utilization to monitor GPU utilization. Netdata offers a variety of options for monitoring different metrics, depending on your specific needs.
In the configuration file, I use low values like 10% for warn and 20% for critical, just for testing purposes. To learn more about configuring alarms, thresholds, and best practices, refer to the official Netdata documentation: Configure alerts | Learn Netdata
Here are some examples of alarms you can configure:
on Option |
Description |
|---|---|
system.cpu |
Monitors overall CPU utilization, including user, system, and idle times. |
system.ram |
Tracks system RAM usage, helping to detect memory shortages or leaks. |
disk.space |
Observes disk space usage across mounted filesystems to prevent storage exhaustion. |
net.interface |
Monitors network interface traffic, including incoming and outgoing data rates. |
nvidia_smi.gpu_utilization |
Measures GPU utilization for systems with NVIDIA GPUs, useful for monitoring GPU load. |
mysql.queries |
Tracks the number of queries processed by a MySQL database server. |
nginx.requests |
Monitors the number of requests handled by an NGINX web server. |
apache.requests |
Observes the request rate for an Apache HTTP server. |
postgresql.transactions |
Tracks the number of transactions in a PostgreSQL database. |
docker.container_cpu_usage |
Monitors CPU usage of Docker containers, aiding in container performance analysis. |
kubernetes.node_cpu |
Observes CPU utilization of Kubernetes nodes, essential for cluster resource management. |
memcached.connections |
Tracks the number of connections to a Memcached server. |
redis.commands |
Monitors the rate of commands processed by a Redis server. |
elasticsearch.search_requests |
Observes the number of search requests handled by an Elasticsearch cluster. |
haproxy.sessions |
Tracks the number of sessions managed by an HAProxy load balancer. |
Restart
To restart the health system in Netdata, use the following command:
sudo $(find / -name netdatacli 2>/dev/null | head -n 1) reload-healthI use find first here to locate netdatacli in case it’s installed in a non-default location, such as outside /etc.
Locate in the Cloud Portal
If you’re using Netdata Cloud, you can locate and manage alarms directly in the Cloud Portal. Here’s how:
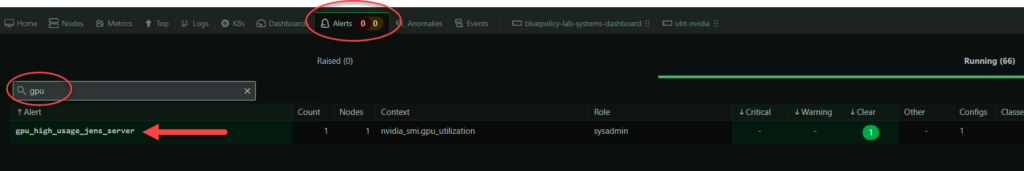
- Change to the Node
- Click on the Alarm Tab
- Change to ‚Running‘
- Locate your Alarm with the Search Box
The Name is reflected in the first row in the config:
template: gpu_high_usage_jens_serverTest your Alarm!
To effectively test GPU monitoring with a higher load than your threshold (10% or 20%), you can use a Docker image designed to stress or burn the GPU. This will generate significant GPU load, ensuring your alarm thresholds are triggered. Here’s how to proceed:
Requirements:
- NVIDIA Driver installed.
- Docker installed.
- NVIDIA Container Toolkit installed (for GPU access in Docker containers).
To test GPU load using the oguzpastirmaci/gpu-burn Docker image, which is designed specifically for generating high GPU load, you can use the following command:
docker run --gpus all --rm oguzpastirmaci/gpu-burn 50The 50 specifies that the GPU will be stressed for 50 seconds, not the percentage of load. The tool will use that duration to stress the GPU, and during this time, Netdata should monitor and trigger the alarm if the GPU usage exceeds your configured threshold.
Review in the Cloud Portal
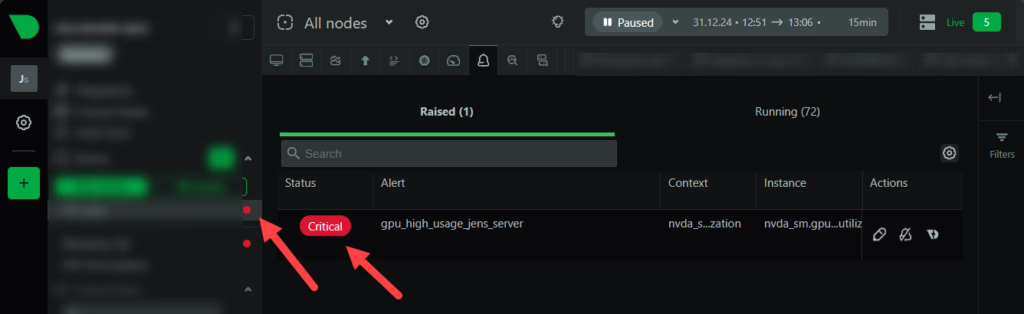
Now, you should see the alarm raised in the Cloud portal as the Docker container runs and generates GPU load! 🙂
You can now add your own custom metrics and alarms. It doesn’t have to be just GPU load—feel free to experiment and explore different possibilities. Have fun and enjoy configuring your monitoring setup!
Disclaimer
The configurations and instructions provided are intended for testing and educational purposes. While they are designed to help you set up effective monitoring and alarms in Netdata, it is important to ensure that you apply them in a way that aligns with your production environment and infrastructure needs.
Any changes made to your system or alarms should be carefully tested and evaluated to avoid unwanted disruptions. Netdata and its related configurations should be used with caution, especially when dealing with critical systems. Always back up your configurations and monitor system performance before applying significant changes.
By following these guidelines, you agree to take full responsibility for any outcomes arising from their use.
Schreibe einen Kommentar